A capnography waveform chart is one of the most useful things you can keep within arm’s reach at a workstation. The number on a capnograph tells you how much carbon dioxide is present. The shape tells you why, and it often tells you first.
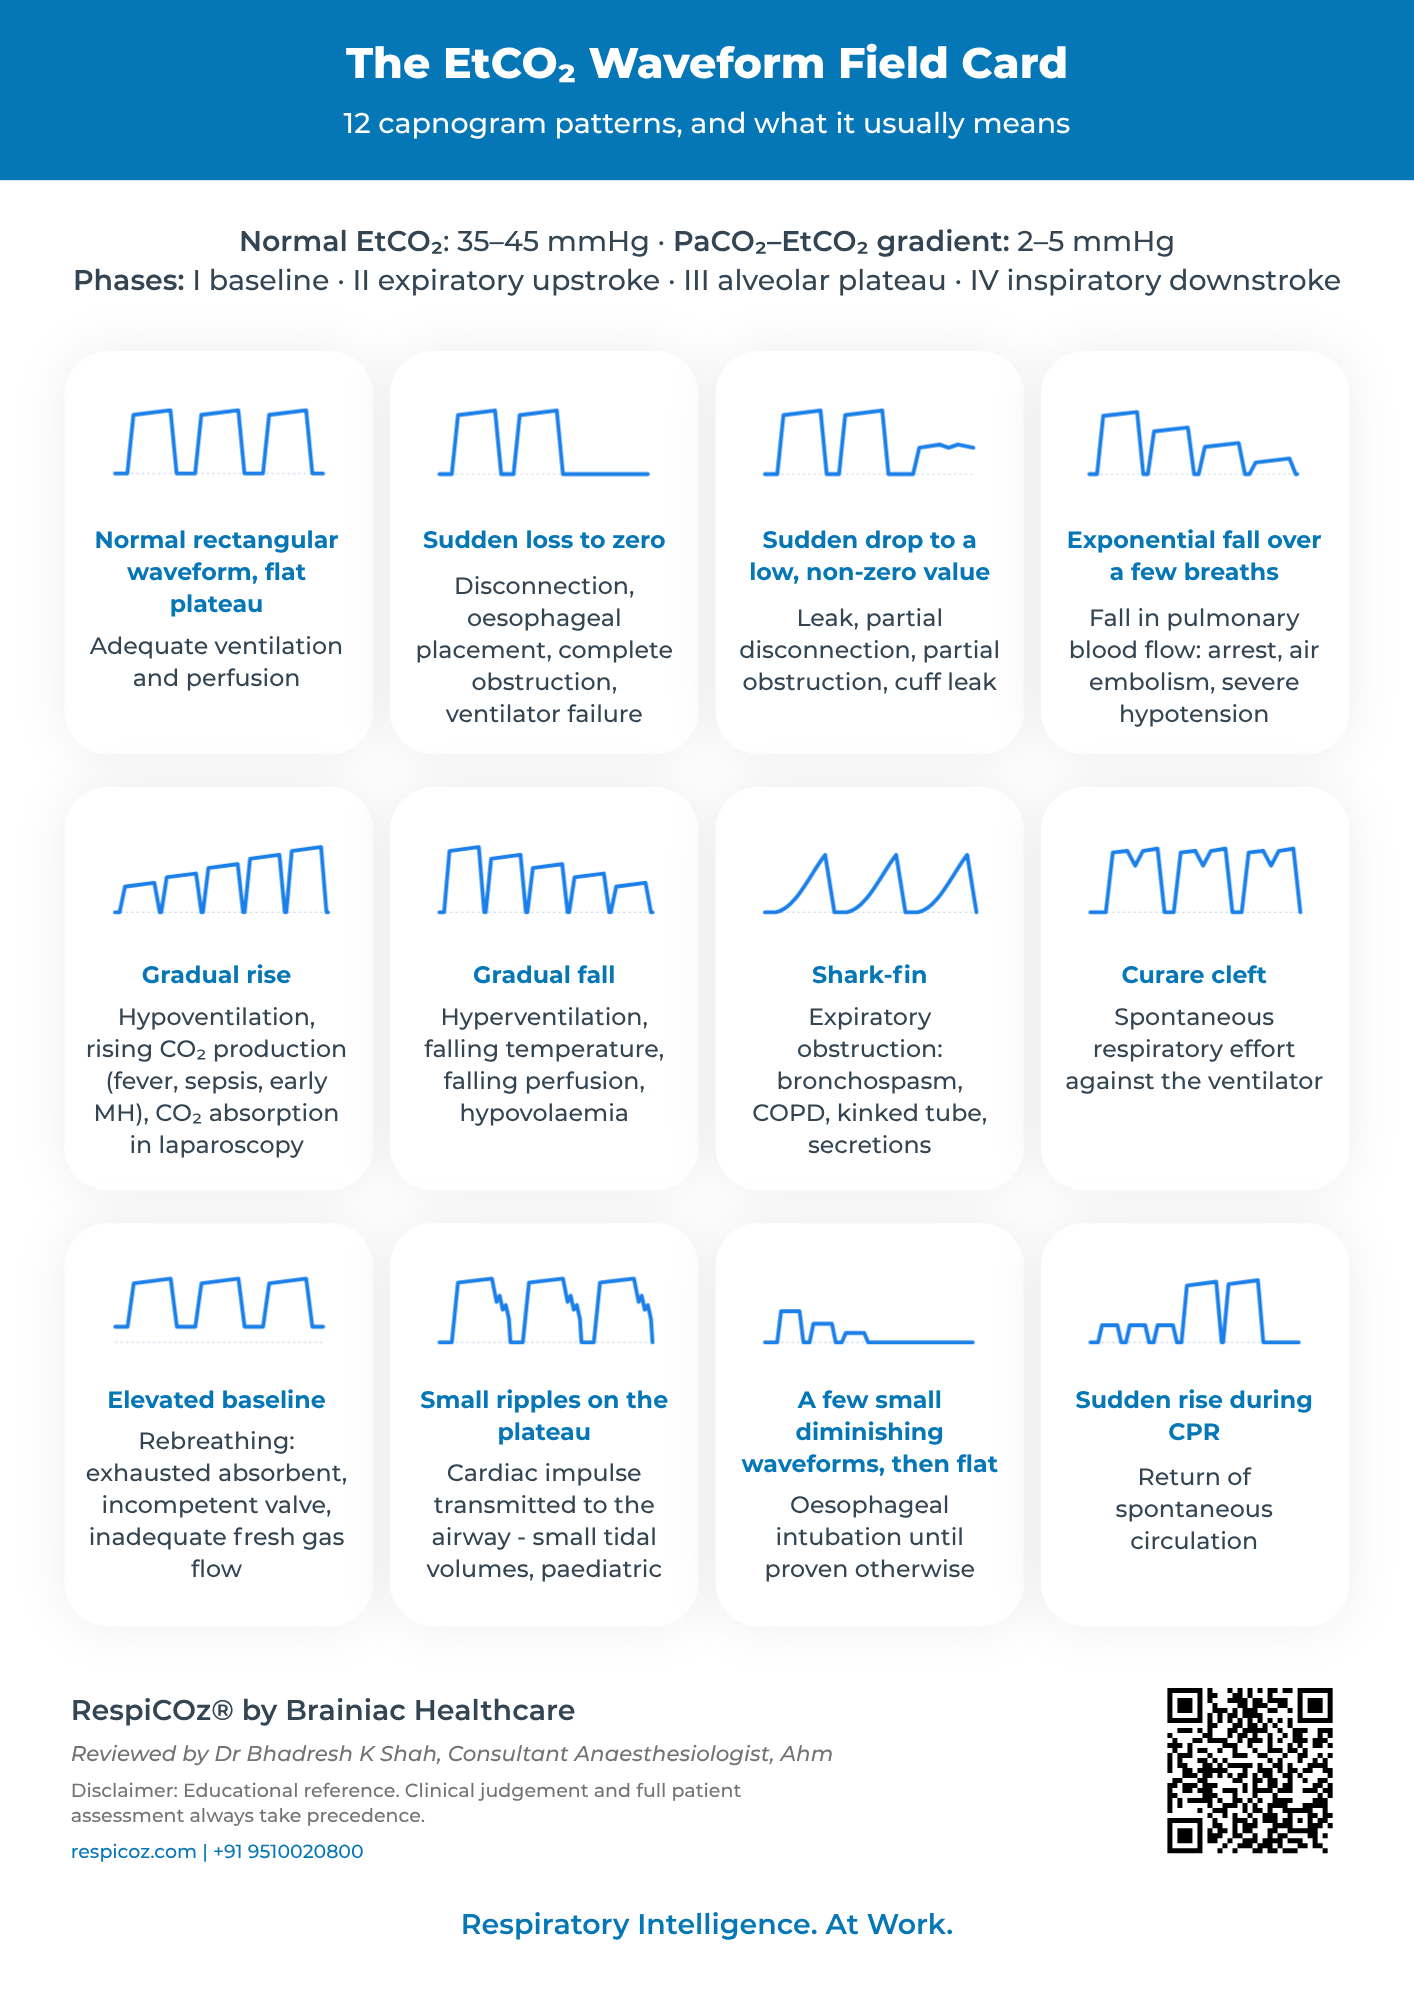
This page sets out the twelve capnogram patterns worth recognising on sight, with what each one usually means. At the end there is a free one-page field card you can download and pin up, reviewed by a consultant anaesthesiologist.
Key takeaways
- The capnogram’s shape often reveals the cause before the number changes.
- A flat line is a lost airway or a disconnection until proven otherwise.
- A shark-fin shape means expiratory obstruction, such as asthma or COPD.
- A baseline that will not return to zero means the patient is rebreathing.
- The one-page field card below is free to download and print.
The essentials, first
Before the patterns, three facts anchor the whole chart.
A normal EtCO2 in a healthy adult is 35 to 45 mmHg. The end-tidal value normally sits 2 to 5 mmHg below the arterial CO2, a gap that widens in shock and trauma and nearly vanishes in pregnancy. And every normal capnogram has four phases: the baseline, the expiratory upstroke, the alveolar plateau, and the inspiratory downstroke. For the full explanation of how to read the trace, see capnography waveforms and the normal EtCO2 range.
The 12 patterns at a glance
Read this as a quick-reference table. Each pattern is described, and then explained in more depth below.
| # | Pattern | What it usually means |
|---|---|---|
| 1 | Normal rectangular waveform, flat plateau | Adequate ventilation and perfusion |
| 2 | Sudden loss to zero | Disconnection, oesophageal tube, complete obstruction, ventilator failure |
| 3 | Sudden drop to a low, non-zero value | Leak, partial disconnection, partial obstruction, cuff leak |
| 4 | Exponential fall over a few breaths | Fall in pulmonary blood flow: arrest, air embolism, severe hypotension |
| 5 | Gradual rise | Hypoventilation, rising CO2 production (fever, sepsis, early MH), CO2 absorption in laparoscopy |
| 6 | Gradual fall | Hyperventilation, falling temperature, falling perfusion, hypovolaemia |
| 7 | Shark-fin | Expiratory obstruction: bronchospasm, COPD, kinked tube, secretions |
| 8 | Curare cleft | Spontaneous respiratory effort against the ventilator |
| 9 | Elevated baseline | Rebreathing: exhausted absorbent, incompetent valve, inadequate fresh gas flow |
| 10 | Small ripples on the plateau | Cardiac impulse transmitted to the airway, in small tidal volumes and paediatrics |
| 11 | Small diminishing waveforms, then flat | Oesophageal intubation until proven otherwise |
| 12 | Sudden rise during CPR | Return of spontaneous circulation |
(Print and pin at your workstation. No sign-up.)
The normal waveform
1. Normal rectangular waveform. A steep upstroke, a flat plateau, a clean return to zero. This is what adequate ventilation and perfusion look like, and it is the shape every other pattern is a departure from. Learn it first, because you cannot recognise abnormal until you know normal.
The sudden changes: emergencies
These demand action first and analysis second.
2. Sudden loss to zero. A flat line. Treat it as a disconnection, a displaced or blocked tube, an oesophageal tube or ventilator failure until you have proven otherwise. Check the patient and the circuit at once. See endotracheal tube confirmation.
3. Sudden drop to a low, non-zero value. Not a complete loss but a partial one. Suspect a leak, a partial disconnection, a partial obstruction or a cuff leak.
4. Exponential fall over a few breaths. The waveform shrinks breath by breath. This points to a collapse in blood flow to the lungs: cardiac arrest, a massive or air embolism, or severe hypotension. See what does low EtCO2 mean.
11. Small diminishing waveforms, then flat. A few small breaths that fade to nothing. This is the classic signature of an oesophageal tube, where swallowed gas washes out over a few breaths. Oesophageal intubation until proven otherwise.
12. Sudden rise during CPR. During resuscitation, an abrupt sustained rise in EtCO2 is often the first sign of the return of spontaneous circulation, before a pulse can be felt. See capnography in cardiac arrest.
The gradual changes: trends
Slow drifts tell a quieter story, usually about ventilation or metabolism.
5. Gradual rise. Hypoventilation, rising CO2 production from fever or sepsis, early malignant hyperthermia, or CO2 absorbed during a laparoscopy. See what does high EtCO2 mean.
6. Gradual fall. Hyperventilation, a falling temperature, slowly falling perfusion, or ongoing blood loss. For both directions, see what causes a rising or falling EtCO2 trend.
The shape changes
Here the height may be normal but the form is wrong, and the form is the diagnosis.
7. Shark-fin. The upstroke slopes and the sharp corner disappears, so the trace looks like a shark’s fin. This is expiratory obstruction: bronchospasm, COPD, a kinked tube or secretions. The steeper the slope, the worse the obstruction, and the shape recovers with a bronchodilator before the number does. See capnography in asthma and COPD.
9. Elevated baseline. The waveform does not return to zero between breaths. The patient is rebreathing carbon dioxide, most often from an exhausted soda lime absorber, a failed valve or inadequate fresh gas flow. See how soda lime affects the capnograph.
The artefacts
These look alarming and are usually explainable. Recognising them prevents needless intervention.
8. Curare cleft. A notch in the top of the plateau, appearing as a muscle relaxant wears off and the patient makes small spontaneous efforts against the ventilator. It is a clinical sign, not a fault.
10. Small ripples on the plateau. Cardiogenic oscillations, caused by the beating heart transmitting an impulse to the airway. They show up with small tidal volumes and in paediatric patients, and are usually benign. For faults and artefacts in full, see capnography troubleshooting.
How to use the field card
The card is designed to be scanned in seconds, not studied. Pin it where intubation and ventilation happen: the theatre, the recovery bay, the resuscitation trolley, the ambulance.
The point is pattern recognition under pressure. When a waveform changes, the card lets you match the shape and reach the likely cause without stopping to think it through from first principles. It is a memory aid for people who already know the clinical reasoning, not a replacement for it. Clinical judgement and full patient assessment always take precedence.
Download the EtCO2 Waveform Field Card (IMAGE). One page, free, no sign-up. It has been reviewed by Dr Bhadresh K Shah, Consultant Anaesthesiologist, Ahmedabad.
Where RespiCOz fits
A chart is only useful if you have a waveform to read in the first place.
RespiCOz is a portable mainstream capnograph that shows the live EtCO2 value, the waveform and the trend together, so every pattern on this card is visible as it happens. It also monitors FiCO2, the inspired carbon dioxide, which is what confirms the elevated-baseline pattern as true rebreathing. The mainstream sensor sits at the airway for a fast, direct reading with no sampling line to block.
It is CDSCO-approved, made in India, carries a two-year warranty, and is priced in the value middle at ₹60,000 to ₹1,00,000. For a fuller look, see the best handheld EtCO2 monitor guide.
Want to know more? Request a quote for your hospital here.
Frequently asked questions
What is a capnography waveform chart? It is a quick reference showing the common capnogram patterns and what each usually means, so a clinician can match a waveform shape to a likely cause at a glance.
What does a normal capnography waveform look like? A rectangular shape with a steep upstroke, a flat alveolar plateau, and a clean return to zero between breaths. It indicates adequate ventilation and perfusion.
What does a shark-fin capnography waveform mean? Expiratory airway obstruction, such as bronchospasm, COPD, a kinked tube or secretions. The upstroke slopes and the sharp corner is lost, and the steeper the slope, the worse the obstruction.
What does a sudden flat capnography line mean? Treat it as an emergency: a disconnection, a displaced or blocked tube, an oesophageal tube, or ventilator failure. Check the patient and the circuit immediately.
Can I download and print the capnography waveform chart? Yes. The one-page field card on this page is free to download and print, with no sign-up, and is designed to be pinned at a workstation.
Conclusion
A capnography waveform chart is a compression of a great deal of clinical knowledge into shapes you can recognise in a second. A flat line, a shark fin, a rising baseline, a fading train of small breaths, each one carries a likely diagnosis in its form.
Learn the normal waveform first, keep the twelve patterns within reach, and read the shape alongside the number and the patient. Print the card, put it where the airways are, and let it do what it is for: turn a glance into a head start.
To go deeper on any pattern, start with the full guide to capnography waveforms.
References
- Capnography waveform interpretation. Capnography.com, Bhavani Shankar Kodali. Capnogram phases and abnormal patterns. capnography.com
- Capnography. StatPearls, NCBI Bookshelf. Waveform interpretation and clinical use. ncbi.nlm.nih.gov